The Graph, Then and Now
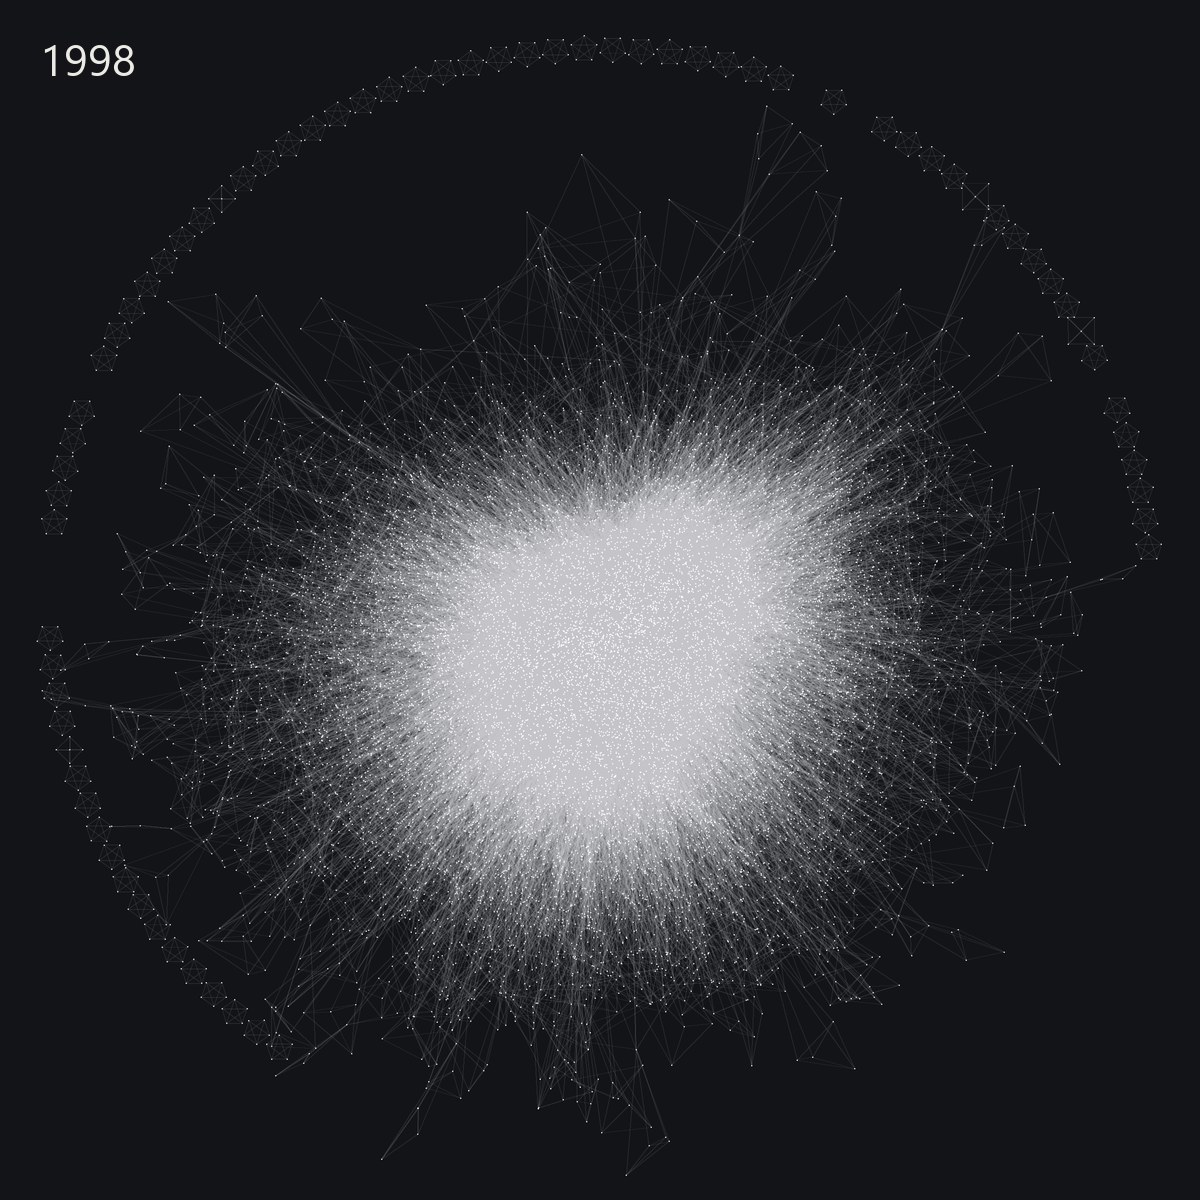
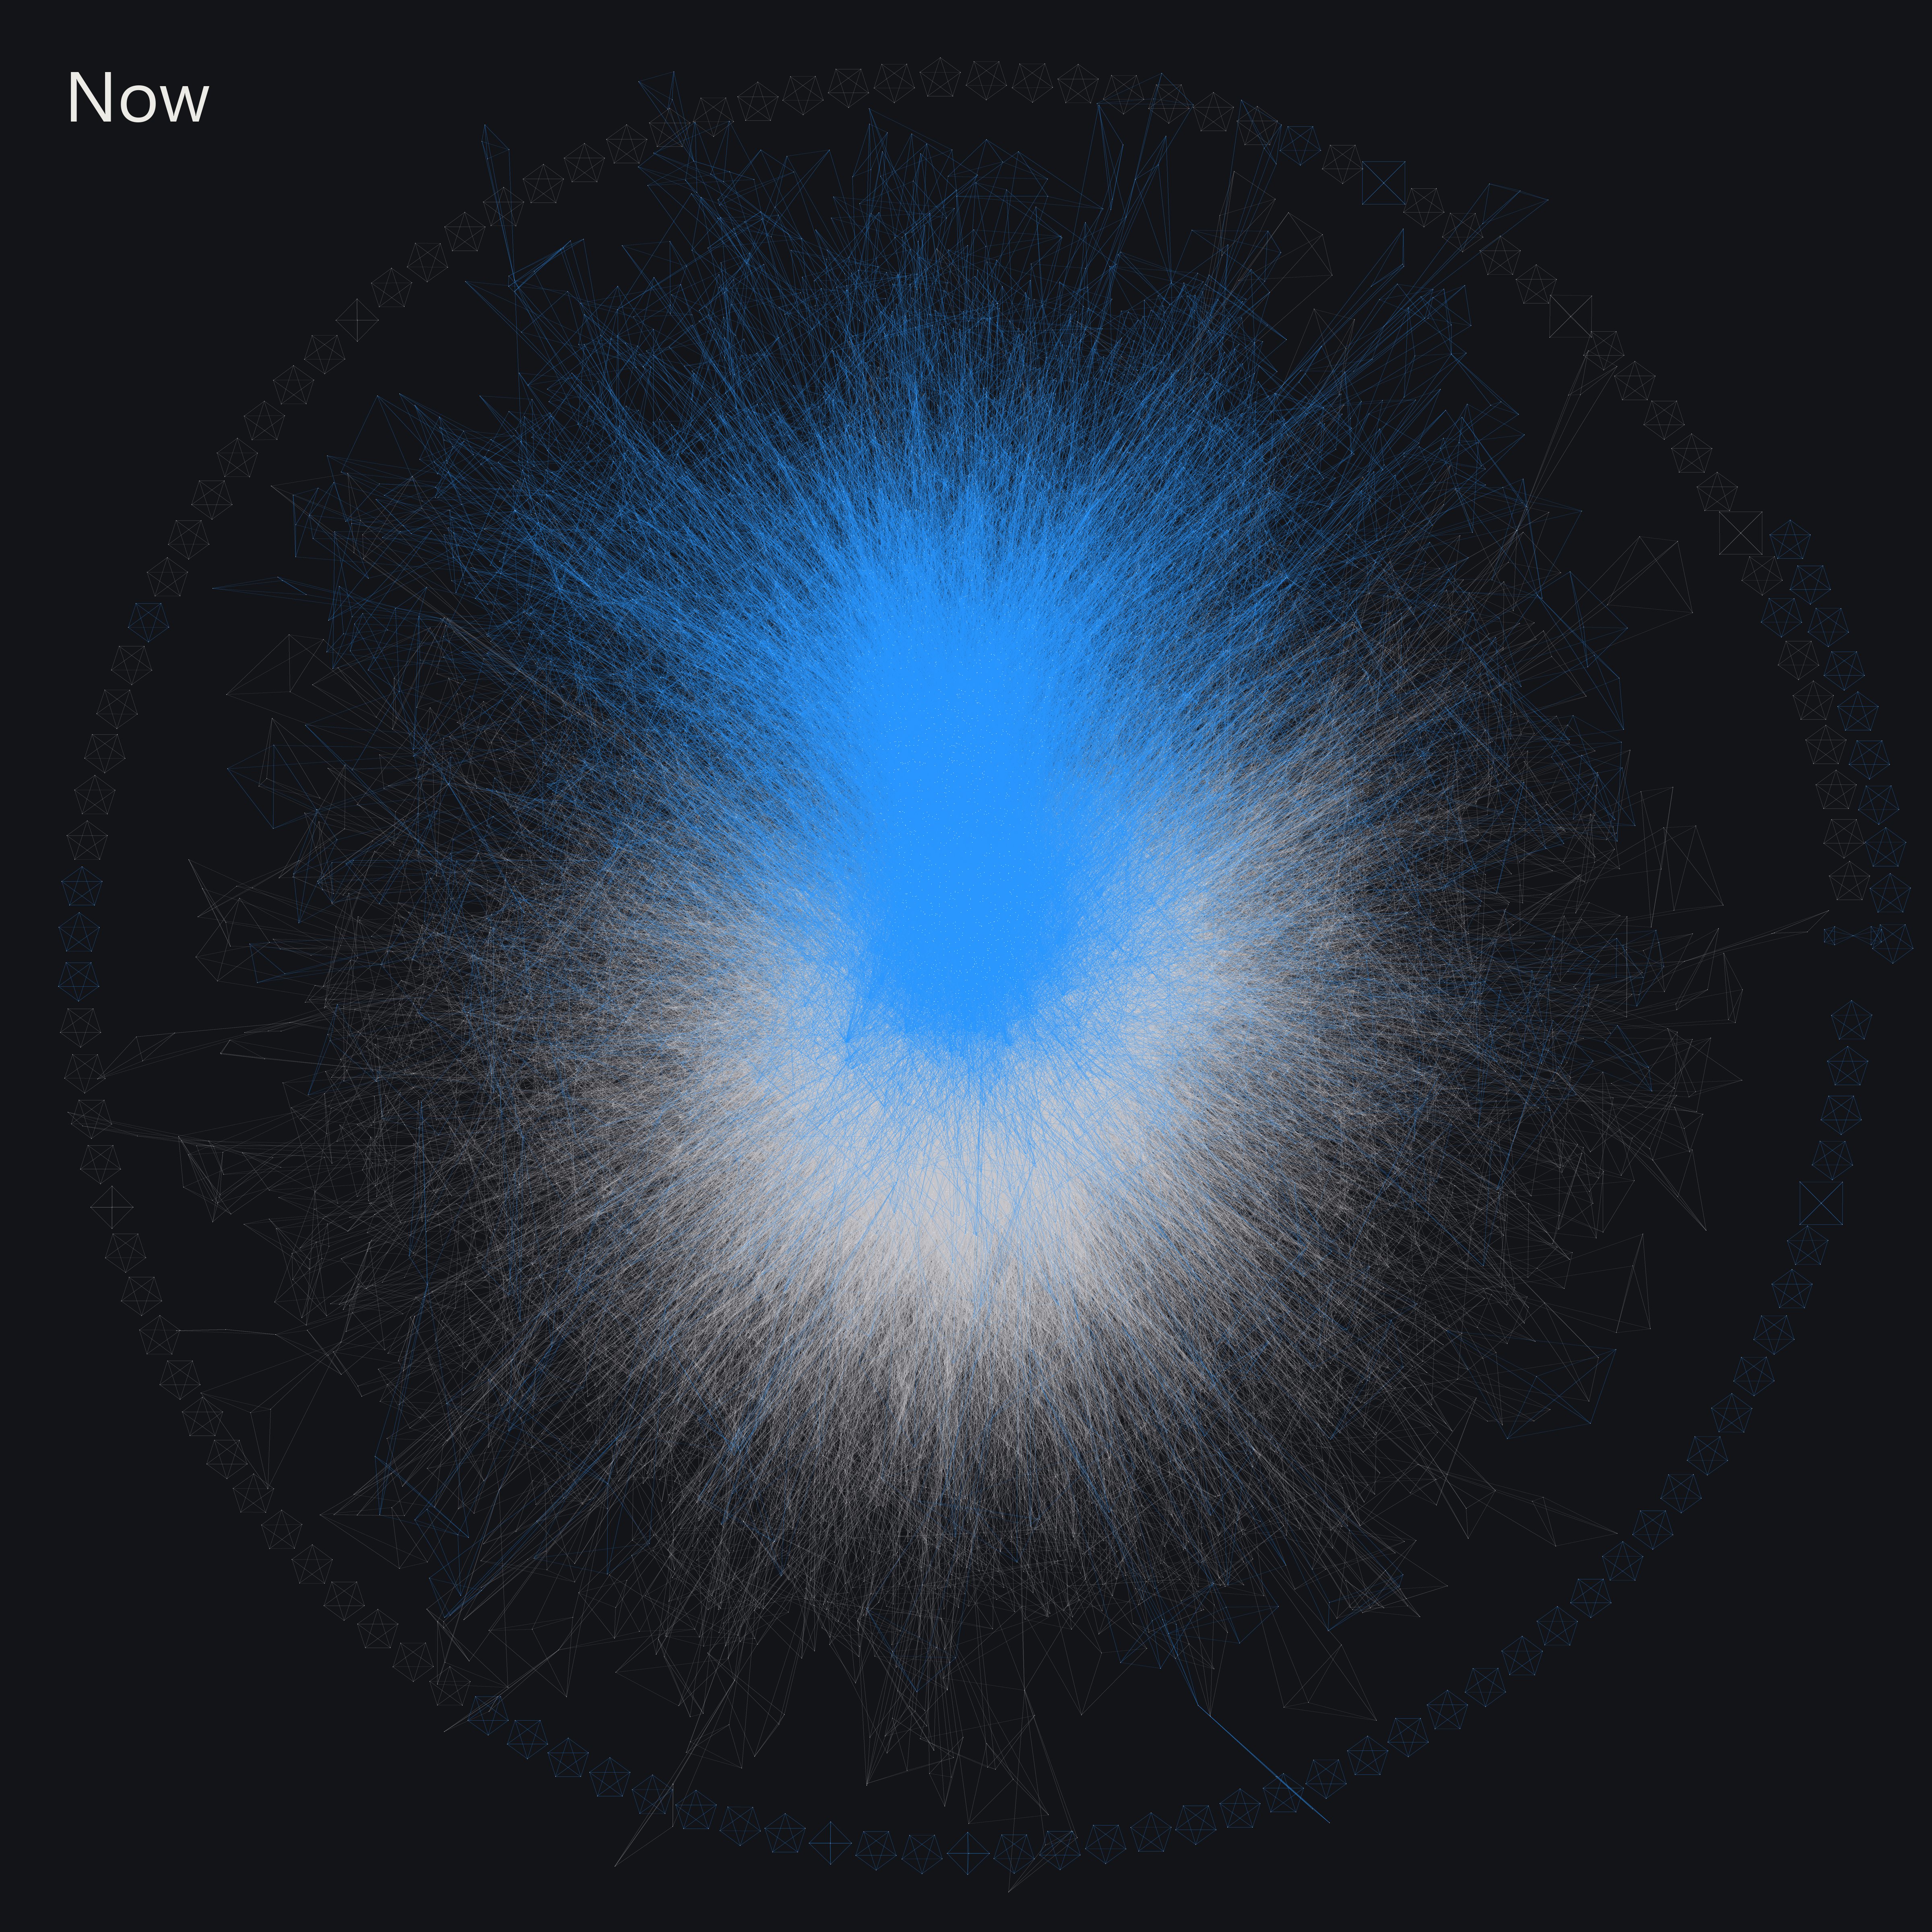
Each white dot is an album, and each line links two albums that turned up together in someone's set of five favorites. The grey lines are the graph as it stood in 1998, about 114,000 links among 14,000 albums, and the blue lines are the roughly 36,000 links added since the engine came back online in 2026. Every line came from a real listener's list, and together they are the whole of what the engine knows when it makes your recommendations.
Look closely at the ring of small stars around the edge. Each one is a single set of five favorites that shares no album with anyone else's list: five albums, each linked to the other four, which draws a star inside a pentagon. The grey stars are orphans from the 1990s still waiting for a connection, and the blue ones that appear under Now are new sets of five from 2026, just as far off the beaten path. View the 2026 graph full size (4 MB).